| (In 000€) | 2011 | 2012 | 2013 | 2014 | 2015 | 2016 | 2017 | 2018 | 2019 | 2020 | 2021 | 2022 | 2023 | 2024 | 2025 |
|---|---|---|---|---|---|---|---|---|---|---|---|---|---|---|---|
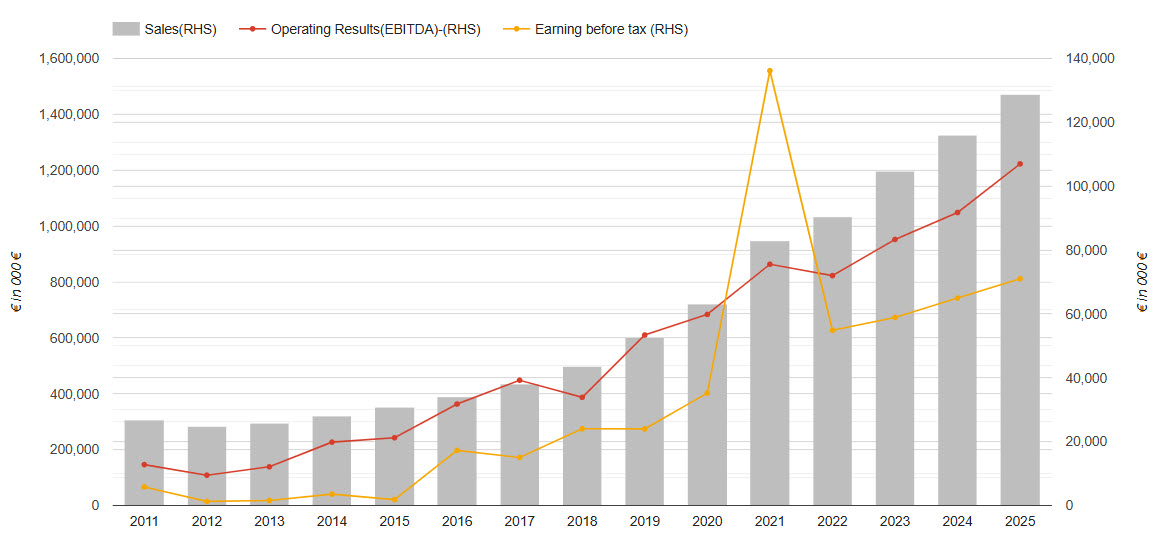
| Sales | 307.333 | 282.918 | 294.652 | 314.949 | 353.405 | 388.227 | 436.449 | 497.680 | 600.319 | 721.359 | 947.882 | 1.031.867 | 1.196.604 | 1.325.352 | 1.470.305 |
| Gross margin | 51.437 | 49.096 | 51.159 | 54.071 | 55.943 | 64.401 | 76.948 | 68.412 | 98.653 | 115.814 | 149.406 | 153.451 | 171.817 | 181.902 | 205.766 |
| Operating Results (EBITDA) | 12.828 | 9.515 | 12.142 | 19.861 | 21.324 | 31.792 | 39.251 | 33.901 | 53.393 | 59.896 | 75.562 | 71.997 | 83.329 | 91.750 | 106.984 |
| Earnings before tax | 5.825 | 1.322 | 1.602 | 3.588 | 1.878 | 17.295 | 15.075 | 24.006 | 30.177 | 35.261 | 136.146 | 54.892 | 58.910 | 64.984 | 71.030 |
| Earnings after tax | 1.161 | -5.856 | -2.789 | 2.025 | -837 | 6.284 | 5.911 | 19.988 | 8.294 | 16.338 | 125.934 | 42.000 | 45.372 | 49.840 | 52.429 |
| Earnings after tax and non-controlling interests | 1.525 | -5.770 | -2.149 | 3.025 | -1.476 | 2.398 | 6.364 | 18.723 | 7.892 | 15.955 | 125.084 | 41.394 | 44.797 | 49.112 | 47.972 |